# Metrics (Data Points & Messages)
The metrics collected by Connectware help you monitor system performance and plan for scaling:
* **Data points**: Represents the number of active endpoints connected to your Connectware instance. This metric helps you understand your system's reach.
* **Messages**: Measures the volume of MQTT messages flowing through the system, giving insight into overall system load.
Review these metrics regularly to:
* Identify usage patterns and trends
* Plan for infrastructure scaling needs
* Detect abnormal message volumes that might indicate issues
* Monitor the growth of your connected device ecosystem
## Metrics View
The **Metrics View** allows you to monitor certain Connectware metrics that are collected hourly and daily. The tables display the date/time of the metrics snapshot, the number of data points per hour/day, and the number of messages that are transferred by the broker during the hour/day.
* To open the **Metrics View**, select **System** > **System Status**, and click the **Metrics** tab.
The **Metrics View** provides two tables that present data. Click **Message per hour** or **Message per day** to open the corresponding sections.
The collected metrics are computed in two ways.
1. The **Number of data points** are a snapshot at the end of the day
2. The **Messages per day** is the sum of all messages per hour for this specific date
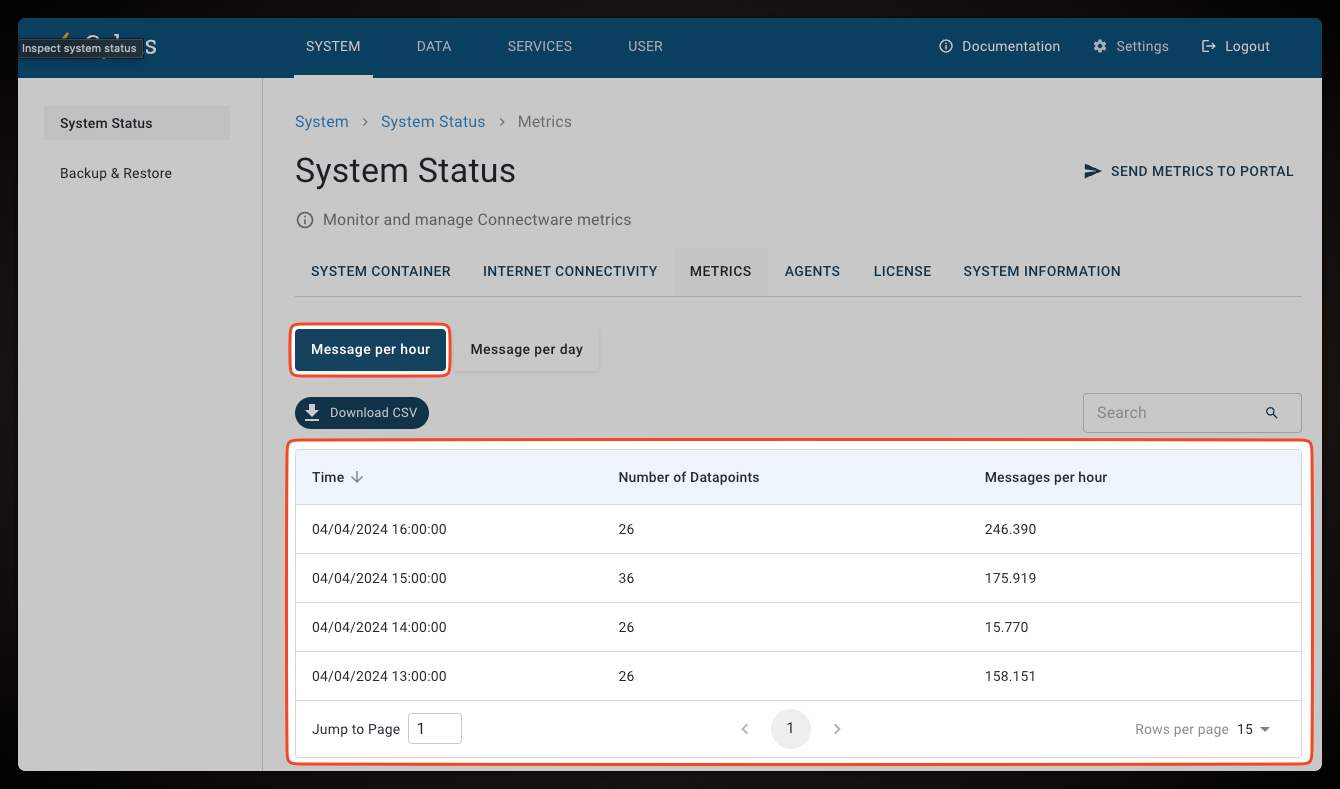
### Hourly Collected Metrics
This table consists of the following columns:
* **Date**/**Time**: Timestamp of the snapshot
* **Number of data points**: Number of connected endpoints
* **Messages per hour**: Number of messages transferred by the CybusMQ broker in the hour between the previous snapshot and the current snapshot
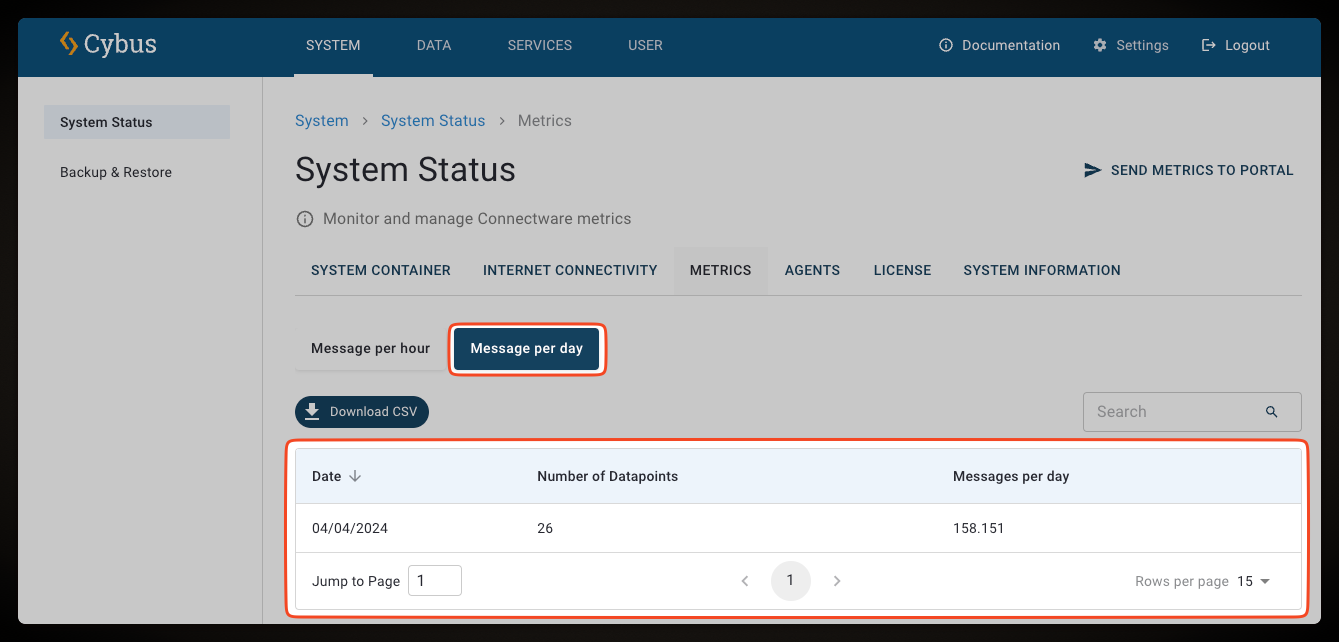
### Daily Collected Metrics
This table consists of the following columns:
* **Date**: Date of the aggregated metrics
* **Number of data points**: Number of connected endpoints
* **Messages per day**: Number of messages transferred by the CybusMQ broker during the day
## Metrics via REST API
The system status API allows you to retrieve metrics about your Connectware instance. For more information, see [System Status (API)](https://docs.cybus.io/2-0-4/reference/api-reference/api-definition-3).