# Data Explorer

The **Data Explorer** displays Connectware's MQTT message flow. Use it to verify that data is flowing correctly, debug integration issues, and understand the structure of your data streams.

The **Data Explorer** provides a centralized interface to visualize, monitor, and troubleshoot MQTT messages in Connectware. Messages are organized into topics, enabling structured data flow between publishers and consumers.

**Key features**

* Browse and subscribe to any MQTT topic in your Connectware instance.
* View message payloads.
* Track message history with timestamps.
* Copy topic paths and JSON payloads for use in configurations.

**When to use the Data Explorer**

* Verify that newly configured devices are publishing data correctly.
* Monitor live data streams to ensure systems are functioning.
* Identify where data flow issues occur in your architecture.
* Understand message structures when building new connections.

For monitoring the MQTT topics of a single service, use the [Live Data](https://docs.cybus.io/2-0-6/documentation/monitoring/live-data) tab instead.

{% hint style="danger" %}
Shared subscriptions are disabled in the Data Explorer to ensure stable operation for all clients connected to the same topics.
{% endhint %}

## Opening the Data Explorer

* To open the Data Explorer, click **Data** in the navigation panel.

<figure><img src="https://639096190-files.gitbook.io/~/files/v0/b/gitbook-x-prod.appspot.com/o/spaces%2FfDpOJO2upcq5EpoSahvK%2Fuploads%2Fgit-blob-6557542c184dbd74ece425abf5c54029529d3b75%2Fdata-explorer.png?alt=media" alt="Screenshot of the Data Explorer main interface"><figcaption></figcaption></figure>

## Monitoring Your First Topic

1. In the **Available Topics** section (left), browse the topic tree.
2. Click the down arrows to expand topic branches.
3. Check the checkbox next to any topic that you want to monitor.
4. The topic appears in **Monitored Topics** (right) with its latest value.
5. Watch the **History** section (bottom) to see updates as they arrive.

## Data Explorer at a Glance

The Data Explorer is divided into the following sections:

* **Available Topics** (left): Browse the topic tree and choose what to monitor.
* **Monitored Topics** (right): See the latest values for your selected topics.
* **History** (bottom): A log of updates received for the monitored topics.

<figure><img src="https://639096190-files.gitbook.io/~/files/v0/b/gitbook-x-prod.appspot.com/o/spaces%2FfDpOJO2upcq5EpoSahvK%2Fuploads%2Fgit-blob-2c2d6c59361faea164738b800001facea3d566c8%2Fdata-explorer-sections.png?alt=media" alt="Screenshot highlighting Data Explorer sections"><figcaption><p>
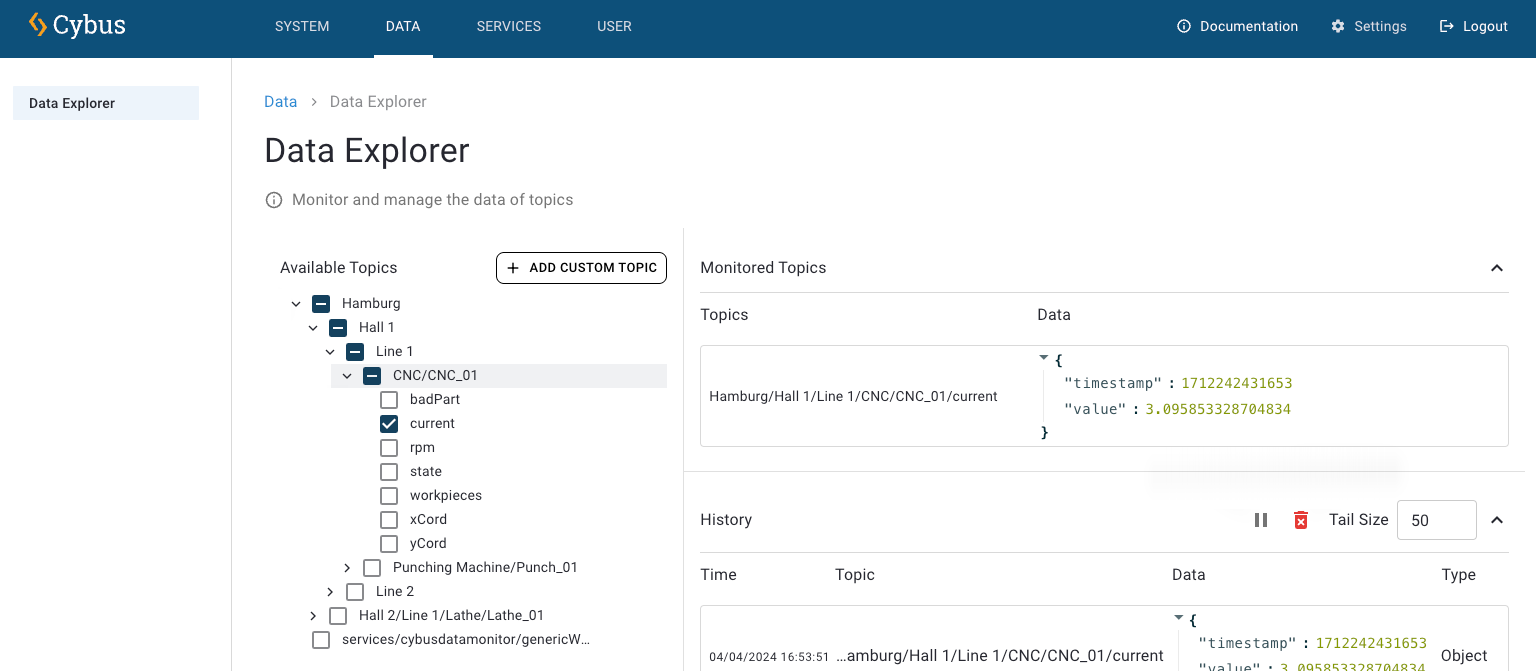
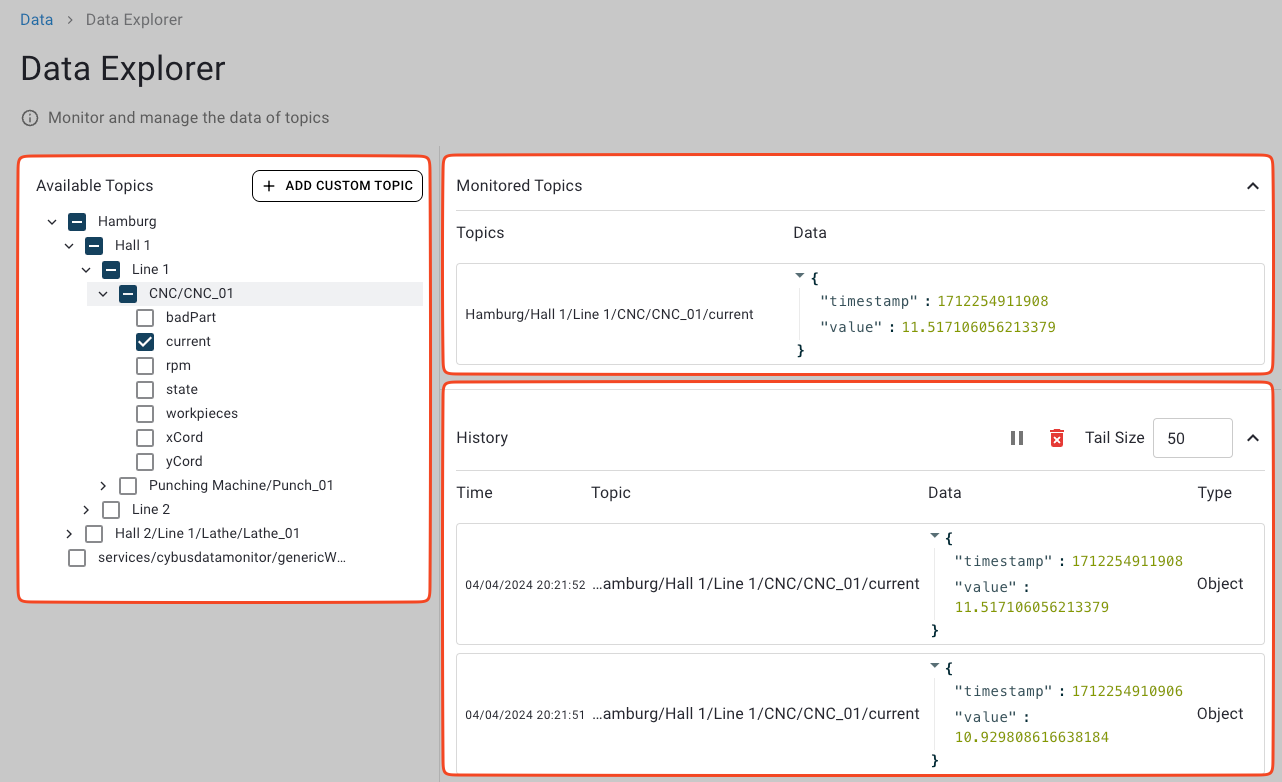
Overview of Data Explorer sections: Available Topics, Monitored Topics, and History.</p></figcaption></figure>

## Available Topics

The **Available Topics** section displays all MQTT topics that are available in Connectware in a hierarchical structure. Topics are organized from general to specific, with base topics at the highest level.

<figure><img src="https://639096190-files.gitbook.io/~/files/v0/b/gitbook-x-prod.appspot.com/o/spaces%2FfDpOJO2upcq5EpoSahvK%2Fuploads%2Fgit-blob-d03856ab3d7aad2a35b7921ebcf5926438fd27bc%2Fdata-explorer-available-topics.png?alt=media" alt="Screenshot of Available Topics tree structure"><figcaption><p>
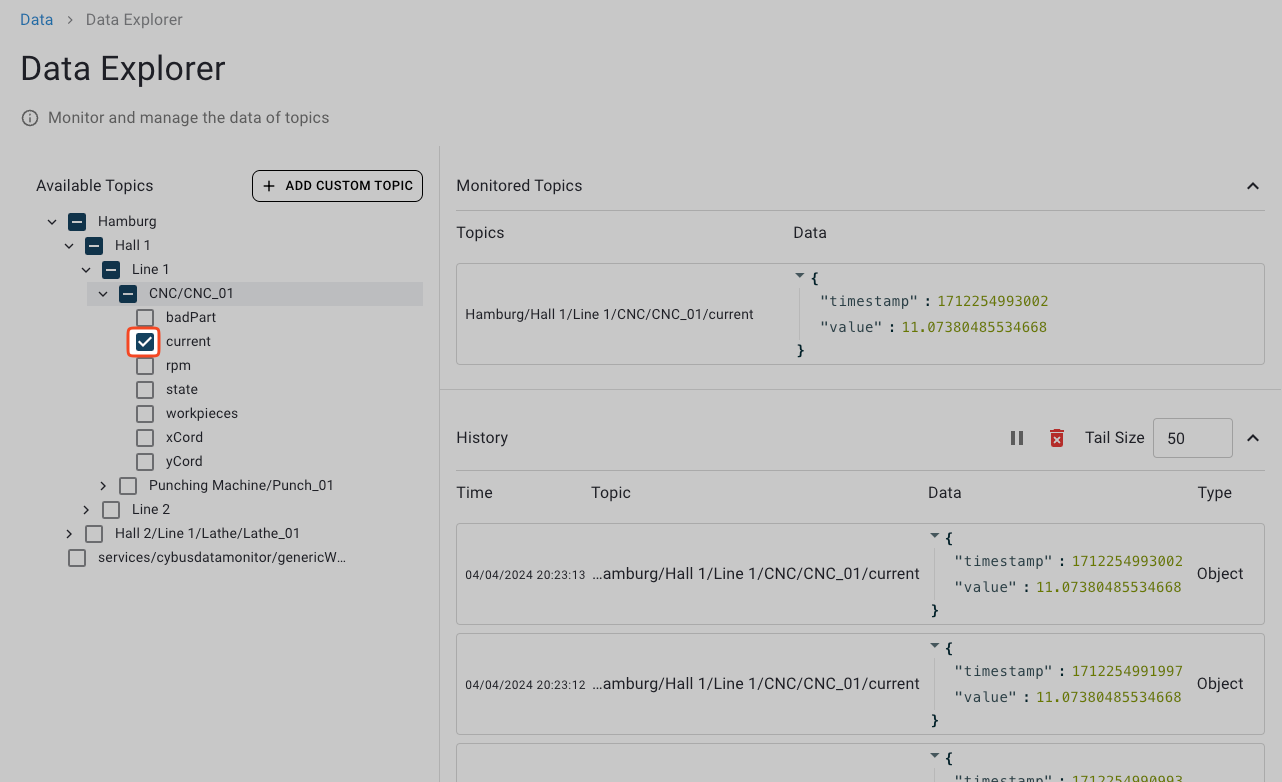
Available Topics section showing hierarchical topic tree.</p></figcaption></figure>

### Wildcard Topics

MQTT supports wildcard subscriptions that let you monitor multiple related topics at once. In the Data Explorer, topics that use named wildcards will not display these labels. Instead, the wildcards will be displayed as **+** in the topic tree.

**Example**: `hamburg/+factory/+floor/+sensor` is displayed as `hamburg/+/+/+`.

## Monitored Topics

The **Monitored Topics** section displays the most recent payload for each topic you have subscribed to. Values update automatically whenever new messages arrive.

The data values displayed in the **Monitored Topics** section correspond to the data type of their topic.

<figure><img src="https://639096190-files.gitbook.io/~/files/v0/b/gitbook-x-prod.appspot.com/o/spaces%2FfDpOJO2upcq5EpoSahvK%2Fuploads%2Fgit-blob-94d5a433d192dc45b0ae82459a7828dbb01a65e5%2Fdata-explorer-monitored-topics.png?alt=media" alt="Screenshot of Monitored Topics section"><figcaption><p>
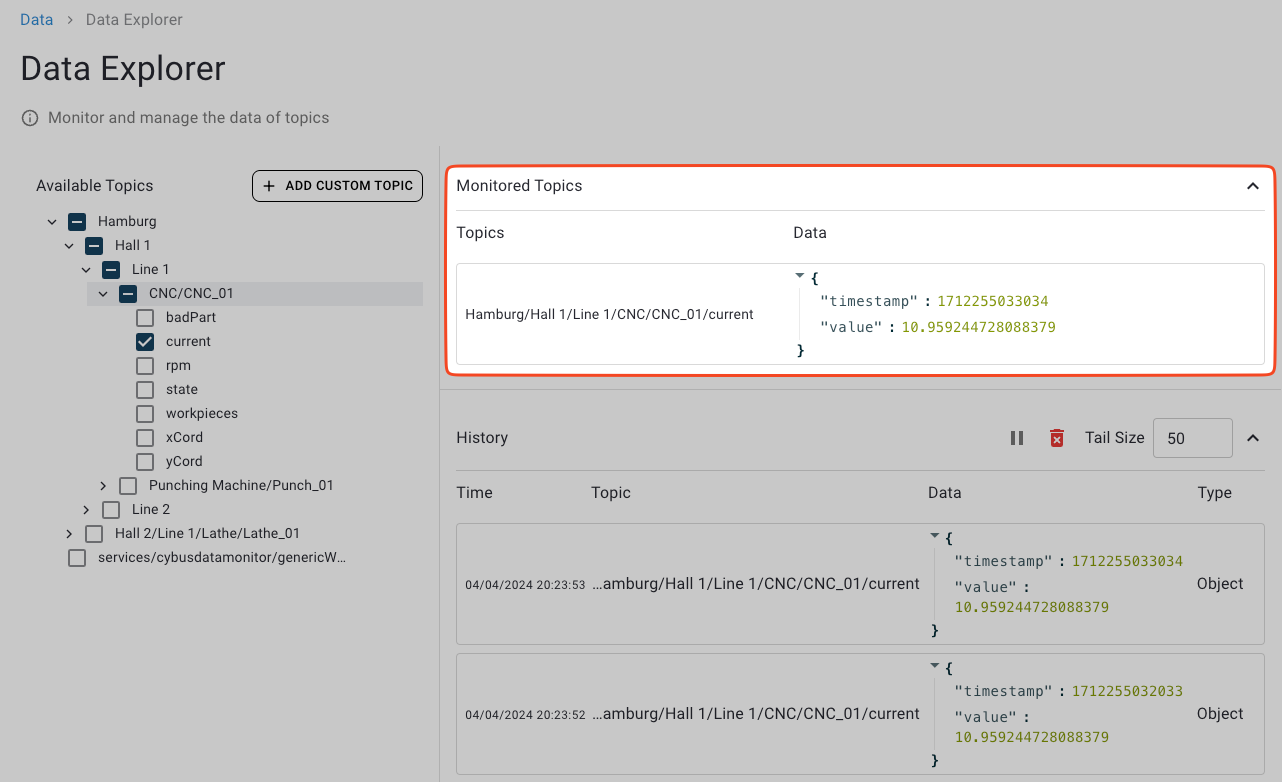
Monitored Topics section displaying latest values for selected topics.</p></figcaption></figure>

### Adding Topics to Monitor

1. Navigate to the **Available Topics** section.
2. Check the checkbox next to the topic that you want to monitor.

**Result**: The topic appears in the **Monitored Topics** list.

### Removing Topics from Monitoring

To stop monitoring a topic, use either method:

#### Method 1 - From Available Topics:

1. Navigate to the topic in the **Available Topics** section.
2. Uncheck its checkbox.

#### Method 2 - From Monitored Topics:

1. Hover your mouse over the topic in the **Monitored Topics** section.
2. Click the **Unsub** button that appears.

### Copying Topic Data to the Clipboard

To copy the data of a topic to your clipboard:

1. Hover over any topic data in the **Data** column of the **Monitored Topics** section.
2. Click the **Copy** icon that appears.

<figure><img src="https://639096190-files.gitbook.io/~/files/v0/b/gitbook-x-prod.appspot.com/o/spaces%2FfDpOJO2upcq5EpoSahvK%2Fuploads%2Fgit-blob-0742a72de7e6acfc7d047384e88112e97d404092%2Fdata-explorer-copy-to-clipboard.png?alt=media" alt="Screenshot showing clipboard icon for copying JSON data"><figcaption><p>
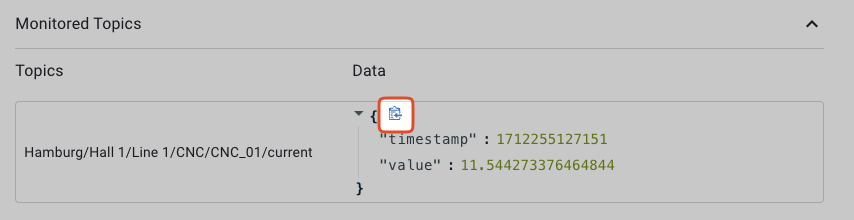
Clipboard icon appears for JSON objects to enable easy copying.</p></figcaption></figure>

### Copying Topic Paths to the Clipboard

To copy a complete topic path to your clipboard:

1. Hover over any topic in the **Topics** column of the **Monitored Topics** section.
2. Click the **Copy** icon that appears.
3. Use the copied path in service configurations, protocols, or mappings.

<figure><img src="https://639096190-files.gitbook.io/~/files/v0/b/gitbook-x-prod.appspot.com/o/spaces%2FfDpOJO2upcq5EpoSahvK%2Fuploads%2Fgit-blob-471fea74fd6a3a929b3f6a001635c8c50829793b%2Fdata-explorer-copy-topic-path.png?alt=media" alt="Screenshot showing clipboard icon for copying topic paths"><figcaption><p>
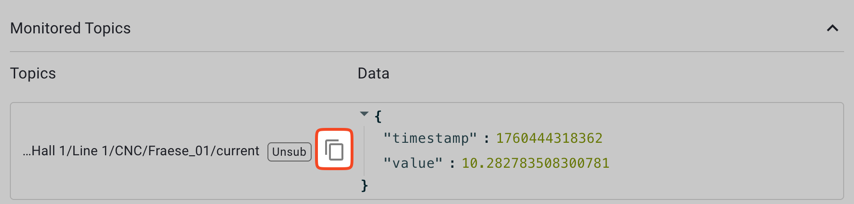
Clipboard icon appears for topic paths to enable easy copying.</p></figcaption></figure>

## History

The **History** section allows you to view logs of all updates from the currently monitored topics. Every time an update to a monitored topic is available, a new log line will be appended to the history.

The data values displayed in the **History** section correspond to the data type of their topic.

<figure><img src="https://639096190-files.gitbook.io/~/files/v0/b/gitbook-x-prod.appspot.com/o/spaces%2FfDpOJO2upcq5EpoSahvK%2Fuploads%2Fgit-blob-cd1fd81c7a5fe9a7a61fd624e72edd7a27d15921%2Fdata-explorer-history.png?alt=media" alt="Screenshot of History log section"><figcaption><p>
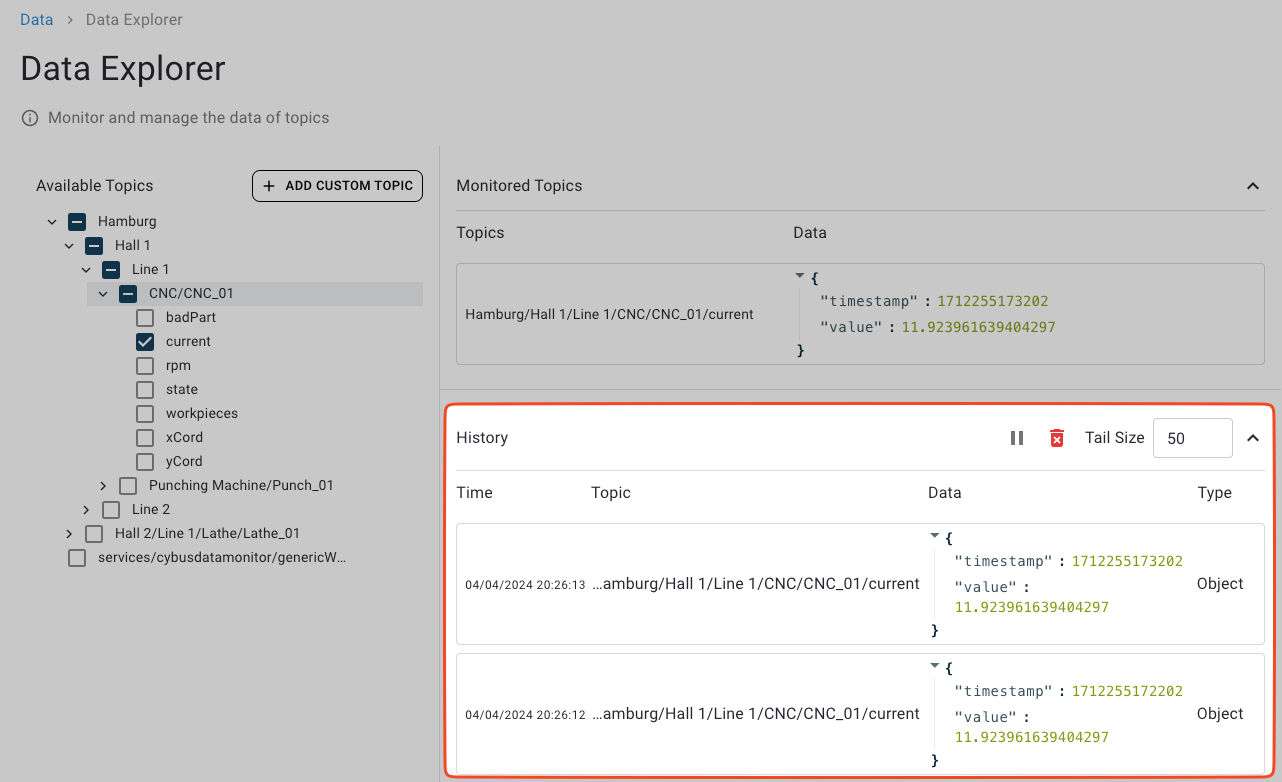
History section showing log of monitored topics.</p></figcaption></figure>

### Pausing or Resuming Log Updates

You can pause the log updates to inspect specific log lines.

* To temporarily stop live updates, click the **Pause** icon in the top-right of the **History** section. Click again to resume.

### Clearing the Log

* To remove all recorded log lines, click the **Trash** icon in the top-right of the **History** section.

### Displaying More or Fewer Log Lines

* To set how many of the most recent log entries the **History** section should display, adjust the **Tail Size** value.
