# Connections View
Connections are resources that allow you to connect to devices over [protocols](https://docs.cybus.io/2-0-6/documentation/industry-protocol-details). The **Connections View** shows an overview of all active and inactive protocol connections.
See also: [Cybus::Connection resource](https://docs.cybus.io/2-0-6/documentation/services/service-commissioning-files/resources/cybus-connection)
In Connectware, you can monitor the connections of all services in the [Connections View](#connections-view) and connections of individual services in the [Connection Details View](#connection-details-view).
## Overview
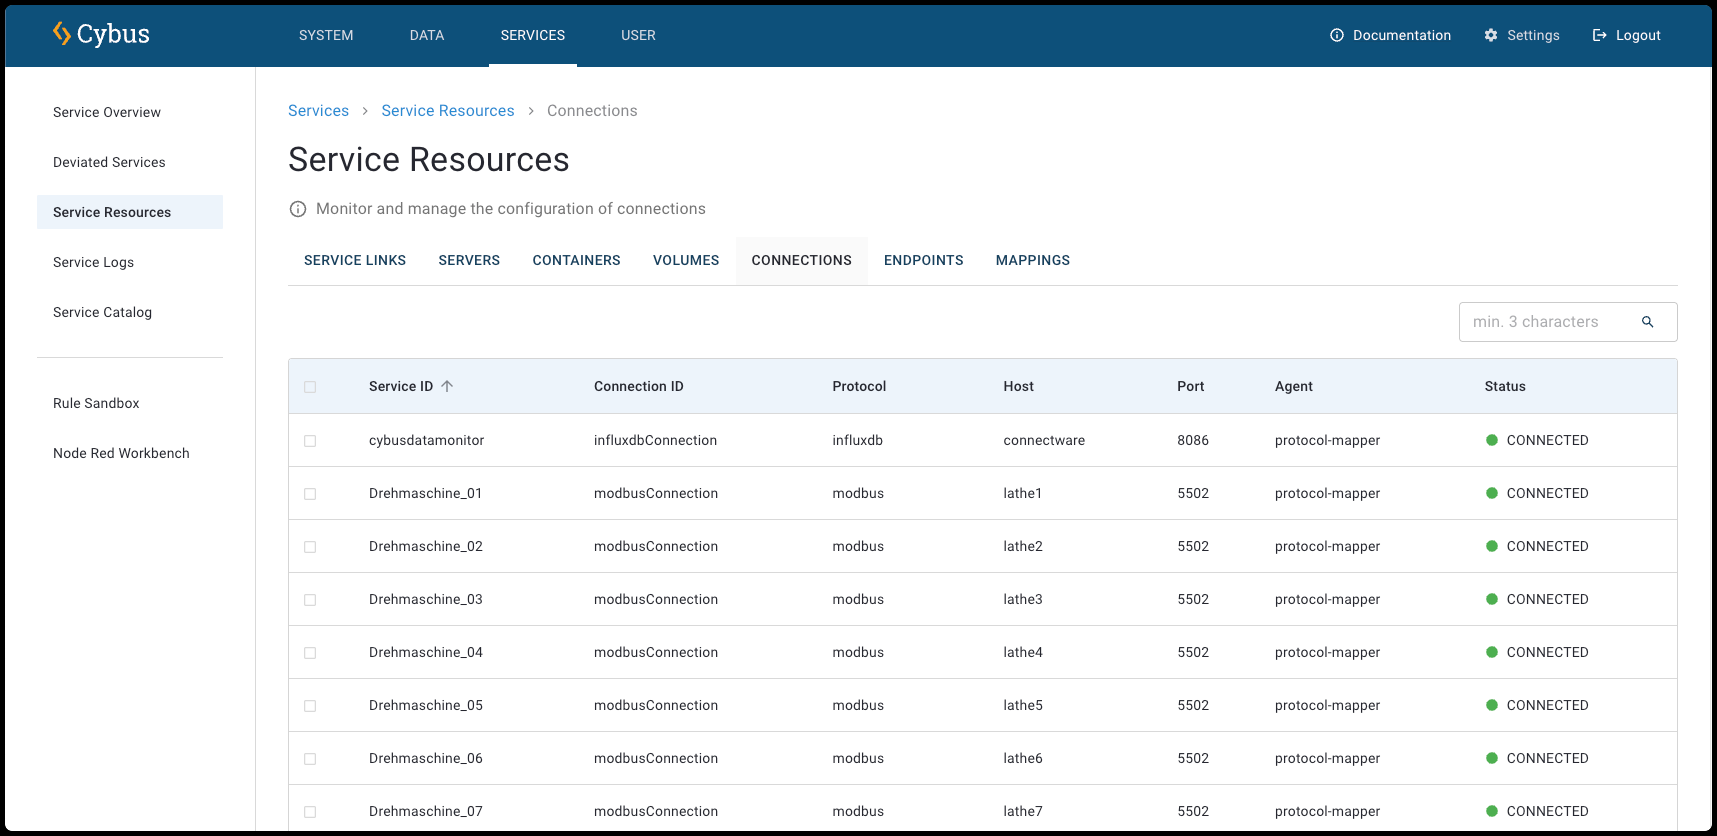
The **Connections View** displays all available protocol connections, including their service ID, connection ID, host, and port. You can click a connection for more information about its configuration. For more information, see [Connection Details View](#connection-details-view).
* To open the **Connections View** for all connections, click **Services** > **Service Resources** and click the **Connections** tab.
Connections View
In the list, all connections are displayed with the following information:
**Service ID**
* The unique identifier of the service that contains this connection.
**Connection ID**
* The unique identifier assigned to this specific connection within the service.
**Protocol**
* The communication protocol used for the connection (e.g., Modbus, HTTPS, OPC UA).
**Host**
* The hostname or IP address of the target system or device.
**Port**
* The network port number used for the connection.
**Agent**
* The agent to which this connection is assigned.
**Status**
* The current state of the connection (e.g., connected or not connected).
## Connection Details View
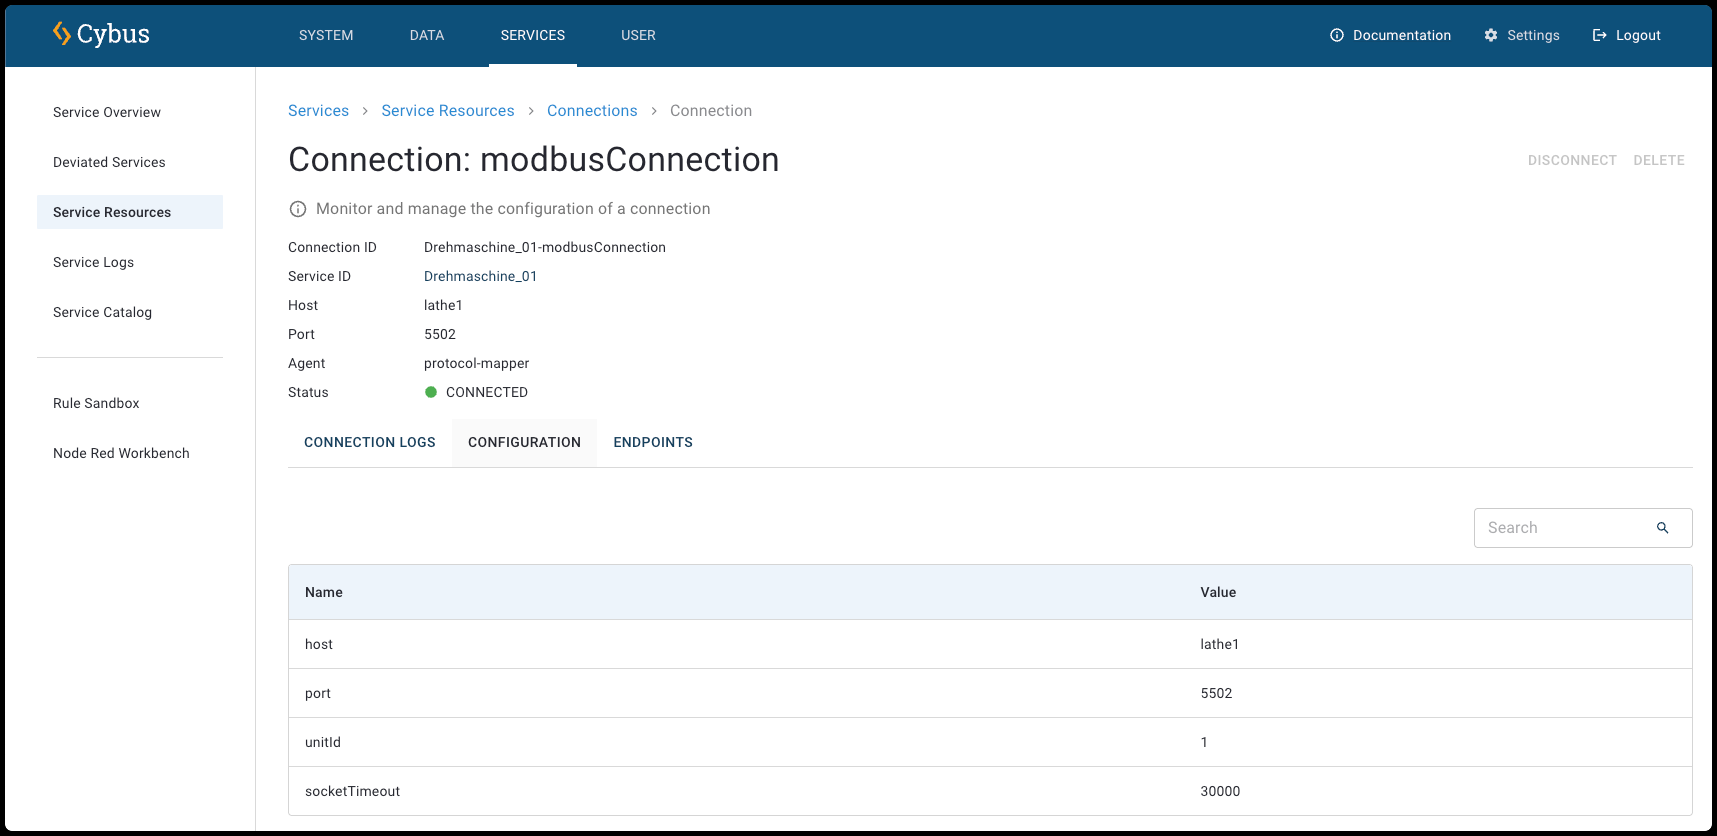
* To open the **Connection View** for a specific service, click **Services** > **Service Overview** and select a service. In the **Service Details View** of the selected service, click the **Connections** tab.
Connections Details View
At the top of the **Connection Details View**, the following information is displayed:
**Connection ID**
* The unique identifier assigned to this specific connection within the service.
**Service ID**
* The unique identifier of the service that contains this connection.
**Host**
* The hostname or IP address of the target system or device.
**Port**
* The network port number used for the connection.
**Agent**
* The agent to which this connection is assigned.
**Status**
* The current state of the connection (e.g., connected or not connected).
## Resources of Connections
Each connection has resources itself.
* To open the resources of connections, click a connection in the **Connections View**.
Connections Details View with open resources
### Connection Logs
You can view detailed log messages for the connections of the selected service in the **Connection Logs** tab of the **Connection Details View**.
**Download CSV**
* Export the visible log entries as a CSV file.
{% hint style="info" %}
The log entries in the CSV file are limited to the most recent 500 lines in the current view. To download the raw logs that contain the full logs, see [Logs of All Services](https://docs.cybus.io/2-0-6/documentation/services/service-logs/service-logs-of-all-services).
{% endhint %}
**Refresh Logs**
* Refresh the log messages to show the most recent entries.
**Filter**
* Use these filters to focus on specific service log message types based on your troubleshooting or monitoring needs. You can filter for **Debug**, **Error**, **Fatal**, **Info**, **Trace**, and **Warn** messages.
**Start Time/End Time**
* Select a specific start date/time and end date/time to define the period for which you want to view log messages.
**Search**
The search allows you to filter the list.
* Minimum search length is 3 characters.
* Search services by service ID or name.
* Search resources by name, ID, protocol, parent resource ID, agent name, or service ID.
* Search is case-insensitive.
**Level**
* The type of message. For example, info or warning.
**Time**
* Shows the exact date and time when each log message was generated.
**Message**
* Displays the message of the log (e.g., **lathe\_01: Enabled InfluxdbConnection**).
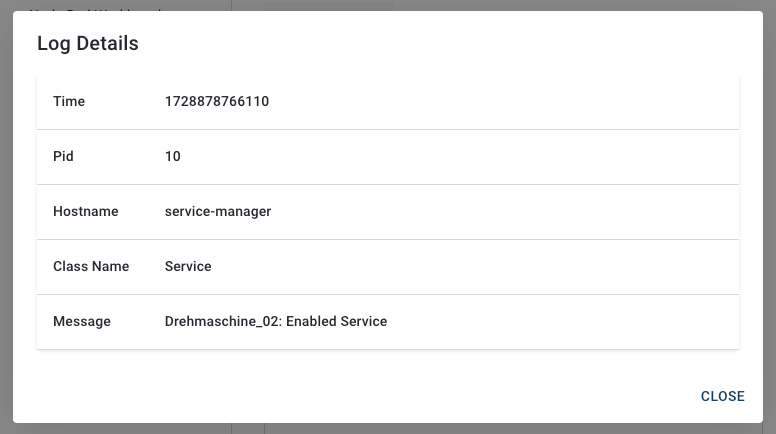
#### Log Details Dialog
The **Log Details dialog** provides in-depth information about specific log entries in the service logs.
* To open the **Log Details dialog**, click a log entry of a service.
When you select a log entry, this dialog displays the following fields:
**Time**
* The timestamp of the log entry in Unix milliseconds format (.e.g., **1728878765733**).
**Pid**
* The Process ID associated with the log entry.
**Hostname**
* The name of the host or service that generated the log (e.g., **protocol-mapper**).
**Class Name**
* The class or category of the log entry (e.g., **InfluxdbConnection**).
**Message**
* A detailed description of the logged event (e.g., **lathe\_01: Enabled ModbusConnection**).
### Configuration
**Name**
* The name of the configuration (e.g., **maxRetryDelay**).
**Value**
* The value of the configuration.
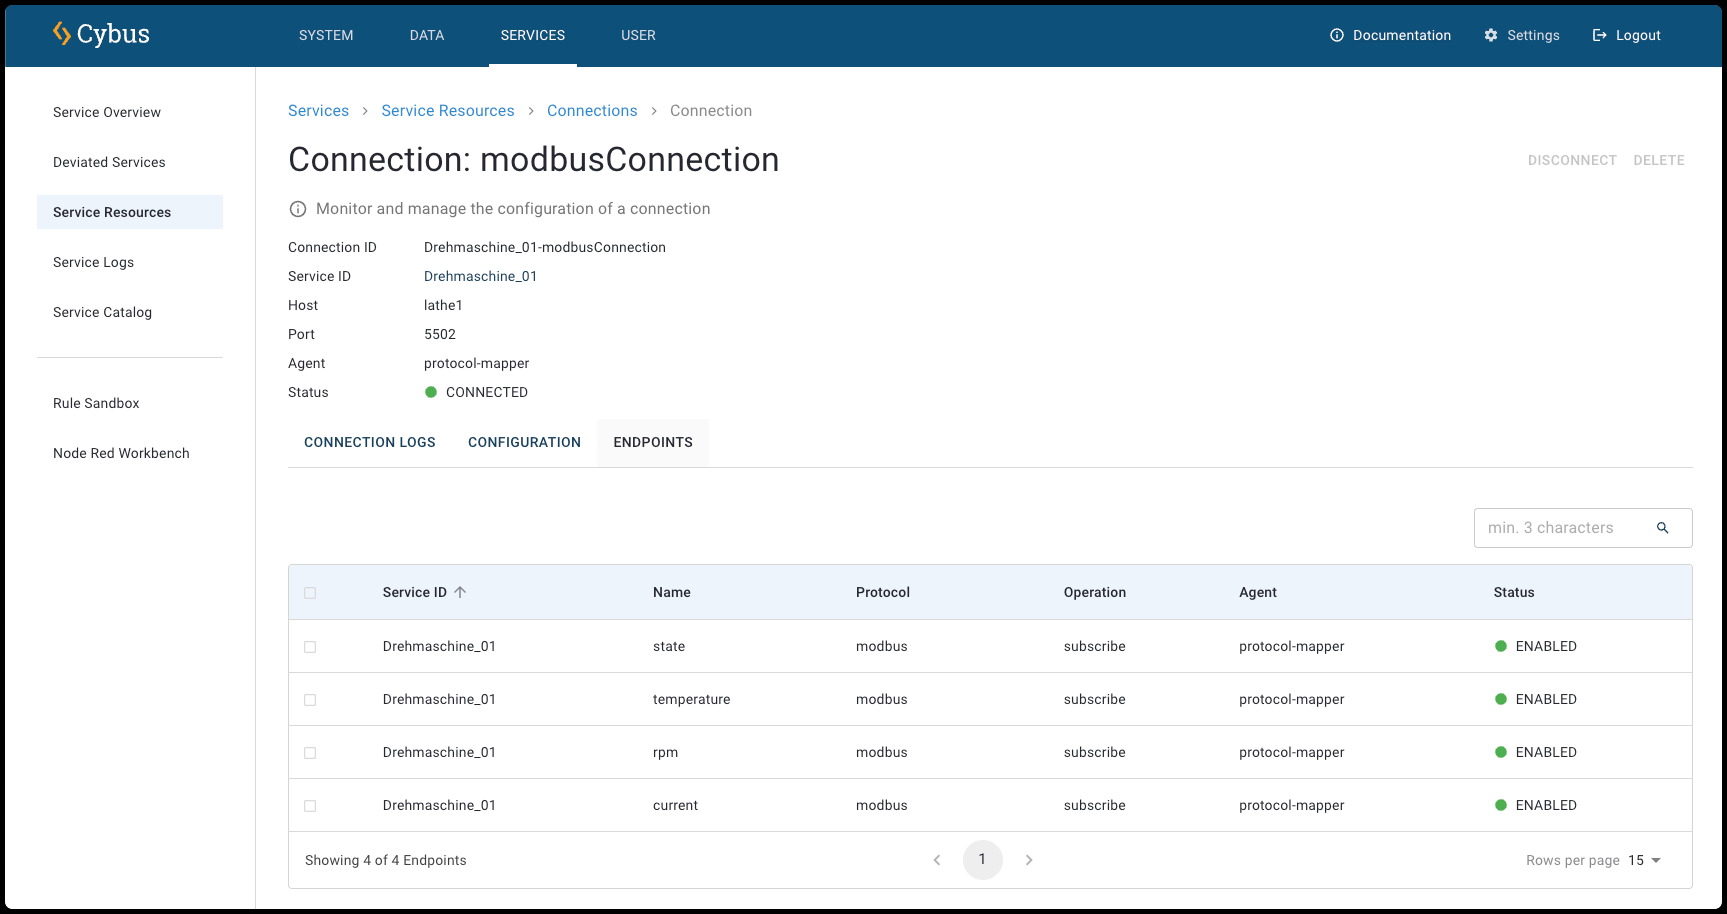
### Endpoints
Lists the endpoints that are associated with the connection.
**Service ID**
* The unique identifier of the service that contains this endpoint (e.g., **lathe\_01**).
**Name**
* The name of the endpoint (e.g., **temperature**).
**Protocol**
* The communication protocol used for the endpoint (e.g., Modbus, HTTPS, OPC UA).
**Agent**
* The agent to which this connection is assigned.
**Status**
* The current state of the endpoint (e.g., enabled or enabling).