> For the complete documentation index, see [llms.txt](https://docs.cybus.io/llms.txt). Markdown versions of documentation pages are available by appending `.md` to page URLs; this page is available as [Markdown](https://docs.cybus.io/2-4-1/guides/right-sizing-kubernetes-resources.md).

# Right-Sizing Kubernetes Resources for Connectware

By default, Connectware sets low CPU and memory requests and no limits, so it can burst onto available node resources when needed. That is deliberate: no single resource configuration fits the range of protocols, message rates, and payloads Connectware supports.

Before deploying to production, size requests and limits for your own workload. This guide walks you through that loop end to end on a local Kubernetes cluster, using a Grafana metrics stack to read what Connectware actually needs. You work through both ways a resource limit can fail:

* **CPU throttling.** Drive the Protocol Mapper with steady load against a tight CPU limit, see throttling in Grafana, and raise the limit until it clears.
* **Memory OOMKill.** Trigger a connection storm against the broker with a tight memory limit, watch the container get OOMKilled and restarted, and size the limit to absorb the spike.

Each failure produces a distinct signal in Grafana, so you learn to recognize both.

## Prerequisites

To follow this guide, you will need the following:

* [Minikube](https://minikube.sigs.k8s.io/docs/start/) installed, with a working Docker or VM driver.
* `kubectl` and `helm` installed and on your `PATH`.
* An MQTT client such as `mosquitto_pub` (from the `mosquitto-clients` package) to generate the example load.
* A valid Connectware license key.
* Basic familiarity with Helm `values.yaml` files.

Connectware needs `ReadWriteMany` (RWX) storage. This guide uses Minikube because its default `standard` StorageClass supports RWX without additional configuration. On other infrastructure, provide an RWX backend such as NFS, Longhorn, or a cloud file storage class. See [Kubernetes Cluster Requirements](/2-4-1/getting-started/system-requirements.md#kubernetes-cluster-requirements).

## Why Connectware Has No Default Resource Limits

A Kubernetes resource **request** is the amount of CPU or memory the scheduler reserves for a container. A **limit** is the ceiling the container may not exceed. Connectware sets requests but no limits by default, which places its pods in the Kubernetes [Burstable](https://kubernetes.io/docs/tasks/configure-pod-container/quality-service-pod/) quality-of-service class: they are guaranteed their requests and may use more when the node has spare capacity.

Limits trade burst headroom for predictability, and the two compute resources behave very differently when a container reaches its limit:

* **Memory:** When a container exceeds its memory limit, the kernel kills it (OOMKilled) and Kubernetes restarts it. That drops in-flight connections and messages and forces a cold start, so an undersized memory limit is the more severe failure.
* **CPU:** When a container reaches its CPU limit, the kernel throttles it rather than killing it. Mild throttling only slows processing, but heavy throttling backs up message queues, increases latency, and can cascade into reconnects and timeouts.

The right values depend entirely on your protocols, message rates, and payload sizes, which is why you measure rather than guess.

## Overview of the Tuning Loop

1. Apply representative load.
2. Read the metrics that reveal bottlenecks.
3. Set requests and limits in the Helm chart.
4. Re-test, and repeat until no throttling or eviction occurs.

## Step 1 — Create a Local Cluster with Minikube

Start a cluster with enough CPU and memory to run Connectware. The default `standard` StorageClass is enabled automatically and provides the RWX storage Connectware needs.

{% code lineNumbers="true" %}

```bash
minikube start --container-runtime=containerd --cpus=6 --memory=12288 \
  --extra-config=kubelet.authentication-token-webhook=true \
  --extra-config=kubelet.authorization-mode=Webhook
```

{% endcode %}

* Adjust `--cpus` and `--memory` to fit your machine. Connectware needs several CPU cores and a few gigabytes of memory to start.

<details>

<summary>Why the <code>containerd</code> runtime and the two <code>kubelet</code> flags?</summary>

`--container-runtime=containerd` lets the kubelet's cAdvisor attribute resource usage to individual containers. With Minikube's default Docker runtime, which routes through cri-dockerd since Kubernetes 1.24, cAdvisor reports only pod-level metrics with an empty `container` label, and the Grafana usage panels stay empty because they filter on `container!=""`.

The two `kubelet` flags let Prometheus authenticate to the kubelet and scrape cAdvisor, which provides the actual CPU and memory usage you tune against. The kubelet enforces authentication and authorization as separate layers, so both flags are required. Without them, the kubelet scrape target fails with an authentication or authorization error and the usage panels in Grafana stay empty, even though requests and limits still appear.

</details>

{% hint style="warning" %}
A local single-node cluster teaches the method, but it cannot reproduce production node sizing, real protocol load, or network-partition timing. Use it to learn the loop, then repeat the whole process on a production-like cluster with your real services before you commit the values.
{% endhint %}

## Step 2 — Install the kube-prometheus-stack

The [kube-prometheus-stack](https://github.com/prometheus-community/helm-charts/tree/main/charts/kube-prometheus-stack) Helm chart bundles Prometheus, Grafana, kube-state-metrics, and node-exporter, along with prebuilt Kubernetes dashboards.

{% code lineNumbers="true" %}

```bash
helm repo add prometheus-community https://prometheus-community.github.io/helm-charts
helm repo update
helm install monitoring prometheus-community/kube-prometheus-stack -n monitoring --create-namespace
```

{% endcode %}

Open Grafana by forwarding its port:

{% code lineNumbers="true" %}

```bash
kubectl port-forward -n monitoring svc/monitoring-grafana 3000:80
```

{% endcode %}

{% hint style="info" %}

## Use separate terminals for blocking commands

`kubectl port-forward` blocks the terminal until you stop it with <kbd>Ctrl</kbd>+<kbd>C</kbd>. Run each port-forward in its own terminal and leave it open for the rest of this guide. Do the same for the load generators in later steps. Give every blocking command its own terminal.
{% endhint %}

Grafana is then available at `http://localhost:3000`. Retrieve the admin password stored in the Kubernetes secret the chart creates:

{% code lineNumbers="true" %}

```bash
kubectl get secret -n monitoring monitoring-grafana -o jsonpath='{.data.admin-password}' | base64 -d
```

{% endcode %}

{% hint style="info" %}
Chart versions change over time. Confirm the release name, secret name, and dashboard titles against the version you install. This guide uses the **Kubernetes / Compute Resources / Pod** dashboard to inspect a single pod in detail, including its CPU Throttling and Memory Usage panels.
{% endhint %}

## Step 3 — Install Connectware

Create a `values.yaml` file with your license key, then install the `connectware` Helm chart.

{% code title="values.yaml" lineNumbers="true" %}

```yaml
global:
  licenseKey: ${LICENSE_KEY} # your Connectware license key
  authentication:
    adminUser:
      initialPassword: ${ADMIN_PASSWORD} # set a known admin password
```

{% endcode %}

{% code lineNumbers="true" %}

```bash
helm install connectware oci://repo.cybus.io/charts/connectware -f values.yaml -n cybus --create-namespace
```

{% endcode %}

* Replace `${LICENSE_KEY}` with your license key.
* Replace `${ADMIN_PASSWORD}` with a password you choose. Kubernetes installations generate a random admin password when you do not set one, so set it here to log in and publish later. See [Default Admin User](/2-4-1/documentation/user-management/users/default-admin-user.md).

This guide uses the release name `connectware` and installs into the `cybus` namespace. For full installation details, see [Installing Connectware (Kubernetes)](/2-4-1/documentation/installation-and-upgrades/installing-connectware/installing-connectware-kubernetes.md).

Wait until all pods are running. Connectware is a LoadBalancer service that Minikube does not expose automatically, so forward both the Admin UI (`443`) and the MQTT data plane (`1883`) with one `kubectl port-forward`. Run it in its own terminal so it can keep running while you work in the others:

{% code lineNumbers="true" %}

```bash
kubectl port-forward -n cybus svc/connectware 10443:443 1883:1883
```

{% endcode %}

Open `https://localhost:10443`, accept the certificate warning, and log in as `admin` with the password you set. For more on accessing the [Admin UI](/2-4-1/getting-started/admin-ui.md), see the installation guide.

## Step 4 — Apply Representative Load

Install a small service that makes the Protocol Mapper do CPU work for every message: it runs a CPU-intensive transform (build a numeric series and sort it), then aggregates the results into bursts. The topics use `${Cybus::MqttRoot}`, which resolves to `services/<service-id>/...`, so the service is permitted to use them. Raise the series length (the `5000` value) to increase the CPU work per message.

{% file src="/files/WDCBWS4X68iixXib48XK" %}

{% code title="resource-sizing-load-example.yml" lineNumbers="true" %}

```yaml
---
version: 1

description: >
  Example load-generating service for resource sizing. On every incoming
  message it runs a CPU-intensive transform (generate a numeric series, sort
  it, and compute statistics), then aggregates the results into bursts. Drive
  the input topic with an MQTT publisher to produce steady CPU load on the
  Protocol Mapper. Raise the series length to increase the load per message.

metadata:
  name: Resource Sizing Load Example

resources:
  transformMapping:
    type: Cybus::Mapping
    properties:
      mappings:
        - subscribe:
            topic: !sub '${Cybus::MqttRoot}/raw'
          publish:
            topic: !sub '${Cybus::MqttRoot}/processed'
          rules:
            - transform:
                expression: |
                  ($v := $number(value);
                  {
                    "value": $v,
                    "sortedTop5": $reverse($sort([1..5000].($ * $v)))[[0..4]]
                  })

  burstMapping:
    type: Cybus::Mapping
    properties:
      mappings:
        - subscribe:
            topic: !sub '${Cybus::MqttRoot}/processed'
          publish:
            topic: !sub '${Cybus::MqttRoot}/batched'
          rules:
            - burst:
                interval: 1000
                maxSize: 100
```

{% endcode %}

Install the service through the Admin UI. Its service ID is `resourcesizingloadexample`, so the input topic resolves to `services/resourcesizingloadexample/raw`. The MQTT port you forwarded in Step 3 (`1883`) is already available, so publish a steady stream of messages to that topic to drive the load. This loop uses `mosquitto_pub`:

{% code lineNumbers="true" %}

```bash
while true; do
  echo '{"value": 72}'
  sleep 0.2
done | mosquitto_pub -h localhost -p 1883 -u admin -P "${ADMIN_PASSWORD}" \
  -t services/resourcesizingloadexample/raw -l
```

{% endcode %}

* Set `${ADMIN_PASSWORD}` in your shell first, for example `export ADMIN_PASSWORD='your-password'`, using the admin password you set during installation. Both this loop and the storm in Step 8 read it, so an empty value fails authentication and produces no load.
* The `-l` flag publishes every line from standard input over a single persistent connection, which avoids reconnecting to the broker for each message. The `sleep` paces the rate.

The right publish rate depends on your hardware, so treat the `sleep` as a starting point, not a fixed value. You want a steady, clearly visible load on the CPU Usage panel to read in the next step, not a maximal one. If the load is too low to read, lower the `sleep`; if the service deviates, raise it.

{% hint style="warning" %}
If the service enters a deviated state while you publish, you are sending messages faster than the Protocol Mapper can process them. The input backlog blocks its single-threaded event loop, which then misses its broker and NATS heartbeats, so Connectware marks the service as deviated. This is a property of the single processing thread, not the node, so a node-level CPU panel can show low overall usage while one core is saturated. Raise the `sleep` until the service stays enabled.
{% endhint %}

Because the Protocol Mapper runs this transform on a single thread, the synthetic load tops out near one CPU core regardless of node size. That is enough to learn the loop.

{% hint style="info" %}
This example only demonstrates the workflow. Replace it with your real production services at production message rates and payload sizes. That is the only load that produces meaningful numbers. For realistic services, see the [Machine Connectivity](/2-4-1/guides/machine-connectivity.md) guides.
{% endhint %}

## Step 5 — Read the Metrics That Matter

On this first read, Connectware is still running with requests only and no limits, so there is nothing to throttle against yet. Focus on actual usage against the request to establish a baseline, then use that baseline to choose initial limits in Step 6. The CPU throttling and OOMKilled signals only appear once limits are set, and are what you watch for when you re-test in Step 7 and Step 8.

The following signals tell you when to adjust across the loop:

| Signal               | Metric or query                                                                      | Meaning                                               | Action                                          |
| -------------------- | ------------------------------------------------------------------------------------ | ----------------------------------------------------- | ----------------------------------------------- |
| CPU throttling       | `rate(container_cpu_cfs_throttled_periods_total[5m]) > 0`                            | The CPU limit is throttling the container.            | Raise the CPU limit.                            |
| Memory near limit    | `container_memory_working_set_bytes` compared to the configured memory limit         | The container risks being OOMKilled.                  | Raise the memory limit.                         |
| CPU usage vs request | `rate(container_cpu_usage_seconds_total[5m])` compared to the configured CPU request | The request is far above or below steady-state usage. | Set the request to the steady-state baseline.   |
| Restarts             | `kube_pod_container_status_restarts_total`                                           | A container was OOMKilled or otherwise restarted.     | Investigate memory limits and the unhappy path. |

Set the dashboard time range to the last 15 minutes so recent changes are clearly visible in the panels.

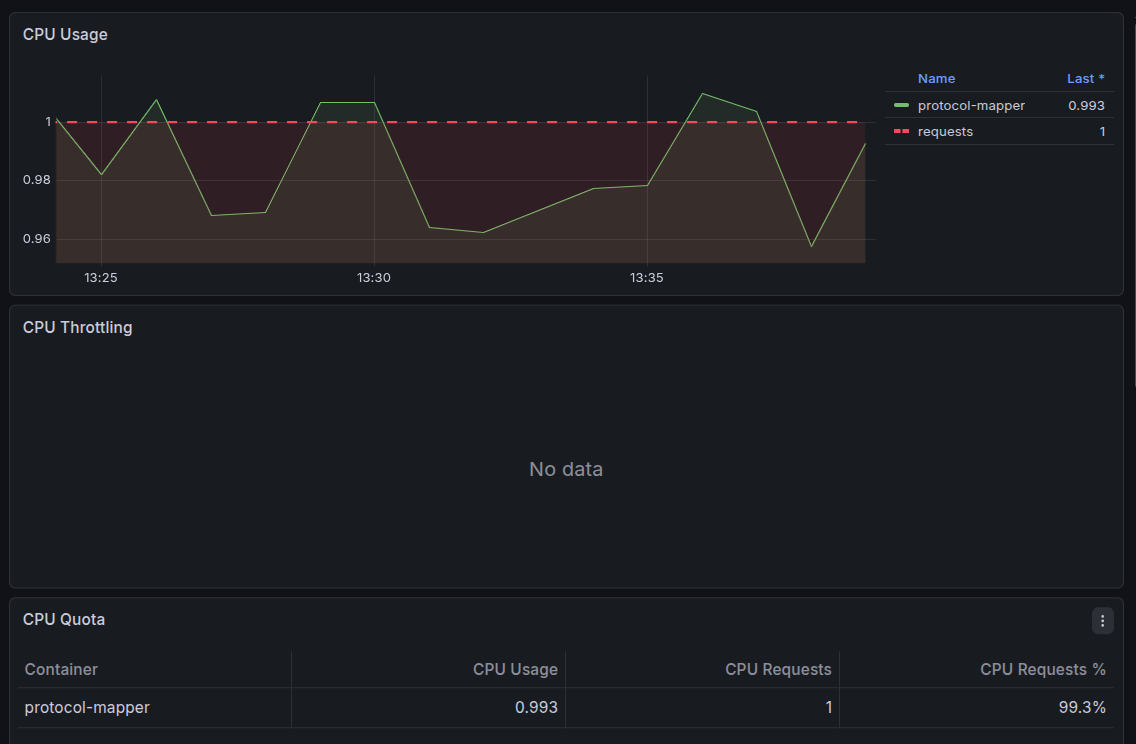
In Grafana, open the **Kubernetes / Compute Resources / Pod** dashboard and select the `cybus` namespace and the `protocol-mapper` pod. The **CPU Usage** panel plots usage against the request line, with no limit line yet because none is set. The **CPU Throttling** panel shows **No data**, because with no limit there is nothing to throttle. The **CPU Quota** table shows usage as a percentage of the request. Repeat for the other Connectware pods to see which consume the most.

<figure><img src="/files/kDVihqoZgRsujsx5fzFJ" alt="Grafana Pod dashboard for protocol-mapper with no CPU limit set: CPU Usage rides right at the 1-core request line, the CPU Throttling panel shows No data, and the CPU Quota table shows about 99 percent of the request."><figcaption><p>Before any limit is set, the <code>protocol-mapper</code> pod draws close to 1 core, around 99% of its 1-core request in this run, and the CPU Throttling panel shows No data because there is nothing to throttle. The single-threaded transform tops out near one core, so steady usage sits a little under it and varies between runs. This is the baseline you size the limit from.</p></figcaption></figure>

## Step 6 — Set Requests and Limits in the Helm Chart

Set limits on the workloads that run hottest. In this example the Protocol Mapper drew close to 1 core in Step 5, so add a CPU limit to it in the `values.yaml` from Step 3. Your own numbers will differ, so use the values you read from your dashboards. A limit must be greater than or equal to its matching request, and the Protocol Mapper's default CPU request is `1000m`, so lower the request as well to put the tight limit below it:

{% code title="values.yaml" lineNumbers="true" %}

```yaml
protocolMapper:
  resources:
    requests:
      cpu: 500m # lowered so the limit can sit below the default 1000m request
    limits:
      cpu: 800m
```

{% endcode %}

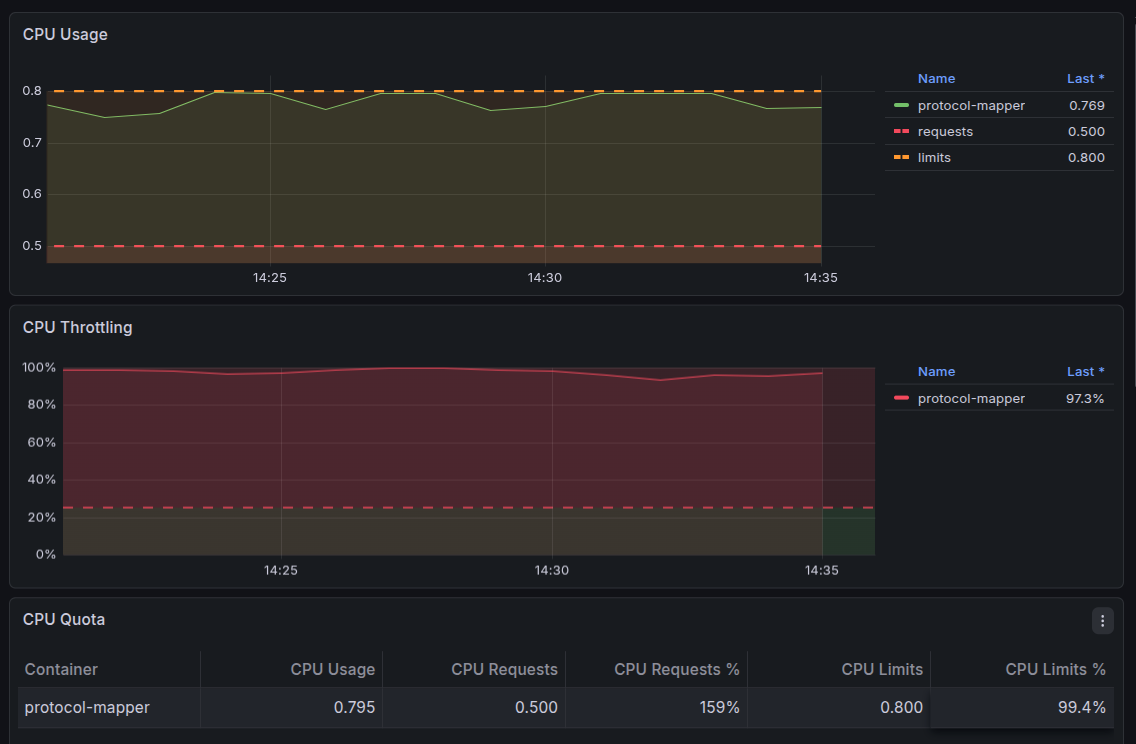
The `800m` limit is intentionally below the steady usage from Step 5, so the re-test in Step 7 shows throttling. Pick your own tight value relative to what you measured. The lowered request only satisfies the requirement that a limit not be below its request; you restore it to your baseline in Step 7. Apply the change with `helm upgrade`:

{% code lineNumbers="true" %}

```bash
helm upgrade connectware oci://repo.cybus.io/charts/connectware -f values.yaml -n cybus
```

{% endcode %}

{% hint style="info" %}
For per-component and per-agent syntax, defaults, and merge behavior, see [Configuring Compute Resources](/2-4-1/cybus-helm-charts/working-with-cybus-helm-charts/compute-resources.md).
{% endhint %}

## Step 7 — Re-Test Until No Throttling

Repeat Steps 4 through 6 with the same load. After the `helm upgrade`, the Protocol Mapper pod is recreated and now runs against its new limit. To see throttling most clearly, open the **Kubernetes / Compute Resources / Pod** dashboard and select the recreated `protocol-mapper` pod. Its **CPU Usage** panel draws the request and limit as reference lines, and its **CPU Throttling** panel shows the throttled percentage directly.

<figure><img src="/files/ZlIS3lw8QcqA6wJzIva6" alt="Grafana Pod dashboard for protocol-mapper: CPU Usage is pinned flat at the 800m limit line, above the 500m request line, and the CPU Throttling panel reads about 97 percent."><figcaption><p>The <code>protocol-mapper</code> pod's CPU Usage is pinned at its <code>800m</code> limit while the CPU Throttling panel reads about 97%. The limit is capping the workload below the steady usage it wants.</p></figcaption></figure>

The CPU Usage trace sits flat against the limit instead of climbing to the workload's demand, while the CPU Throttling panel reads high. That is throttling: the limit is capping the workload below its demand.

If you prefer the command line, the same signal is in the container's CPU statistics. The `nr_throttled` and `throttled_usec` fields count how often and how long the container was throttled and climb while throttling occurs:

{% code lineNumbers="true" %}

```bash
kubectl exec -n cybus deploy/protocol-mapper -- cat /sys/fs/cgroup/cpu.stat
```

{% endcode %}

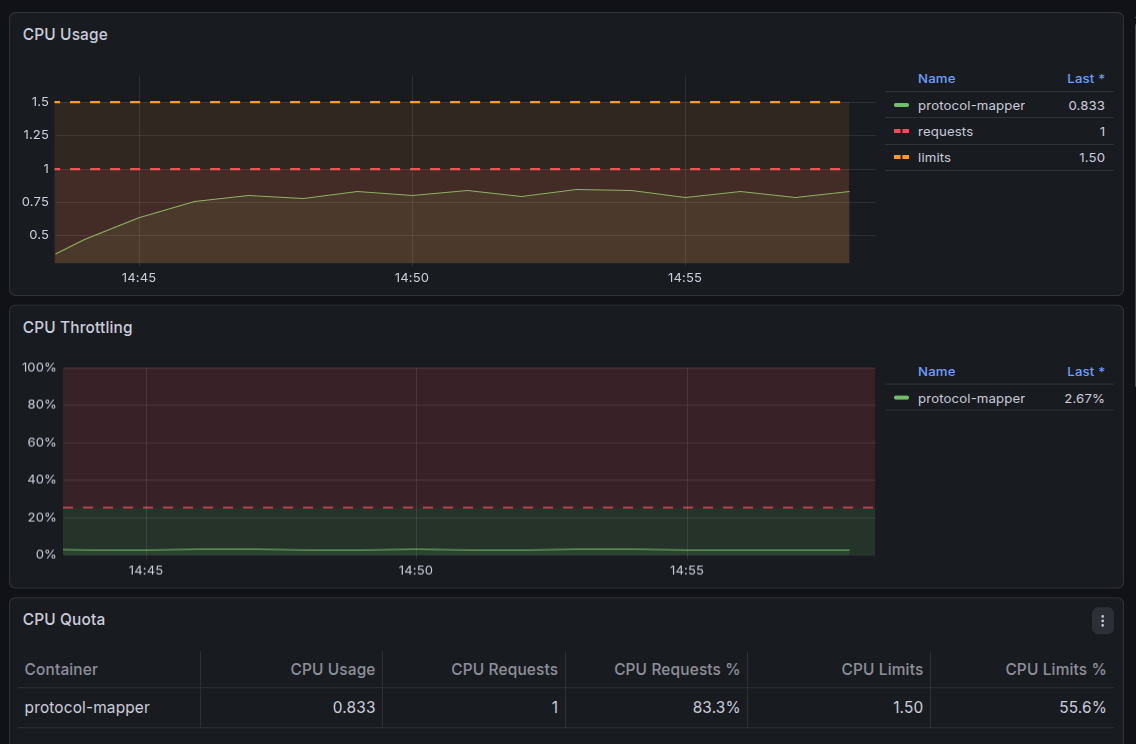
Raise the limit above the observed peak, for example to `1500m`, and set the CPU request to the steady-state baseline you measured in Step 5, about `1000m`:

{% code title="values.yaml" lineNumbers="true" %}

```yaml
protocolMapper:
  resources:
    requests:
      cpu: 1000m
    limits:
      cpu: 1500m
```

{% endcode %}

Apply it with `helm upgrade`, then re-test:

{% code lineNumbers="true" %}

```bash
helm upgrade connectware oci://repo.cybus.io/charts/connectware -f values.yaml -n cybus
```

{% endcode %}

<figure><img src="/files/GhC13eIKGbvTvWvLi0A3" alt="Grafana Pod dashboard after raising the CPU limit to 1500m: CPU Usage holds around 0.83 cores, below the 1-core request and well under the 1.5 limit line, and the CPU Throttling panel drops to about 3 percent."><figcaption><p>With the limit raised to <code>1500m</code>, the <code>protocol-mapper</code> pod uses about 0.83 cores with headroom to the 1.5-core limit, and throttling falls to about 3%. This limit is right-sized for the current load.</p></figcaption></figure>

The configuration is right-sized for steady-state load when throttling is negligible and every container's working set stays comfortably below its memory limit at peak.

## Step 8 — Test the Unhappy Path

Steady-state load is not the worst case. The heaviest moments are connection storms: when many clients reconnect at once, the broker rebuilds sessions and the Auth Server authenticates every new connection. These spikes stress different components than your steady-state transform load, and they can exceed the steady-state baseline.

The publisher from Step 4 holds a single persistent connection, so it never stresses authentication or session setup. To reproduce a connection storm, open many short-lived connections in parallel. Each connection performs a new authentication and opens a new broker session:

{% code lineNumbers="true" %}

```bash
# Flood the broker with short-lived connections. Stop with Ctrl+C.
# Each connection authenticates against the Auth Server and opens a broker session.
# The subshell keeps wait scoped to these connections.
(
  while true; do
    for i in $(seq 1 200); do
      mosquitto_pub -h localhost -p 1883 -u admin -P "${ADMIN_PASSWORD}" \
        -t services/resourcesizingloadexample/raw -m '{"value": 72}' &
    done
    wait
  done
)
```

{% endcode %}

* Raise the `200` connection count if the spike is too small to read on your hardware.
* Set `${ADMIN_PASSWORD}` in this shell first; an empty password fails authentication and produces no load.

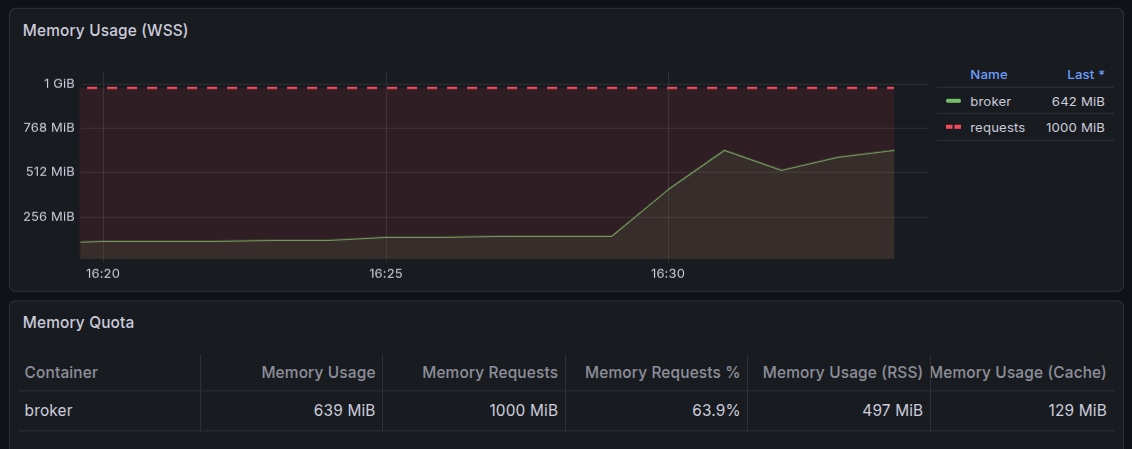
In the **Kubernetes / Compute Resources / Pod** dashboard, select a broker pod such as `broker-0` and open its **Memory Usage (WSS)** panel. As the storm churns sessions, the broker's working set climbs well above its idle baseline. The Auth Server and broker CPU climb too, but the resource you size next is the broker's memory.

<figure><img src="/files/pKiMKyA0MKOfup67boBR" alt="Grafana Pod dashboard Memory Usage (WSS) panel for the broker during a connection storm: the working set climbs from about 130 MiB to about 640 MiB, staying well below the 1000Mi request line, with no limit set."><figcaption><p>During the connection storm, the broker pod's working set climbs from about 130 MiB to about 640 MiB, around 64% of its 1000Mi request. With no memory limit set, the broker has headroom and survives. This is the peak your limit must clear.</p></figcaption></figure>

So far only the Protocol Mapper has limits; the broker and Auth Server still run on requests alone, so that burst headroom is what keeps them alive here. The danger is the opposite case: a limit sized for steady state rather than for the storm. The next part shows what that looks like.

### Forcing an OOMKill During the Storm

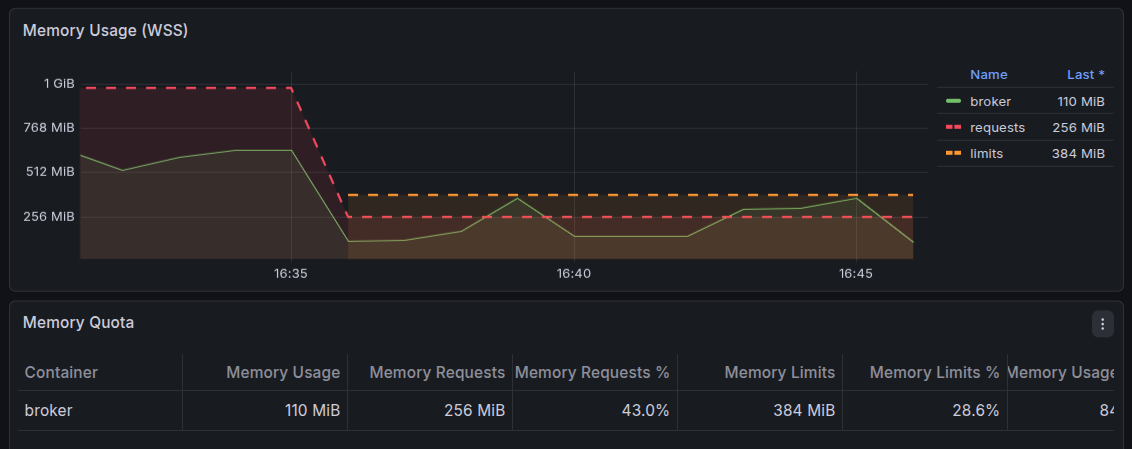
A memory limit fails differently from a CPU limit: instead of throttling, it is a hard ceiling, and when the working set crosses it the kernel OOMKills the container and Kubernetes restarts it, dropping every session the broker held. To see this, set a broker memory limit below the storm peak you just measured, then drive the storm again from idle. Stop the running storm with <kbd>Ctrl</kbd>+<kbd>C</kbd> first; starting from idle lets you watch the memory climb to the limit before the kill.

The broker's default memory request is `1000Mi`, above the roughly 640 MiB storm peak, so as with the CPU request in Step 6, lower the request to put a tight limit below the peak:

{% code title="values.yaml" lineNumbers="true" %}

```yaml
broker:
  resources:
    requests:
      memory: 256Mi # lowered so the limit can sit below the default 1000Mi request
    limits:
      memory: 384Mi # below the storm peak, to force an OOMKill
```

{% endcode %}

The tight request is only to provoke the OOMKill. You restore it in the next change.

With the storm stopped, apply the change:

{% code lineNumbers="true" %}

```bash
helm upgrade connectware oci://repo.cybus.io/charts/connectware -f values.yaml -n cybus
```

{% endcode %}

Once the broker pods are running again, start the storm with the same command as before. The **Memory Usage (WSS)** panel for `broker-0` now draws the limit line as well as the request. The working set climbs with the storm until it reaches the `384Mi` limit, then the kernel OOMKills the container and the trace drops as it restarts. Because the storm ramps over several seconds, the climb to the limit is clearly visible before each kill.

<figure><img src="/files/0qKCigC6xku653xJwhBE" alt="Grafana Pod dashboard Memory Usage (WSS) panel for the broker with a 384Mi memory limit: the working set repeatedly rises to the 384Mi limit line and drops as the container is OOMKilled and restarts; a taller section at the left shows the earlier period before the limit was set."><figcaption><p>With the <code>384Mi</code> limit set (the orange line), the storm drives the broker's working set up to the limit, where the container is OOMKilled and restarts, dropping the trace, and it hits the limit again as the storm continues. The taller section at the left is the earlier spike, before the limit was applied.</p></figcaption></figure>

### Checking Why a Container Restarted

A restart count above zero means a container stopped and was recreated. To confirm the cause, describe the pod and read the last state of its containers:

{% code lineNumbers="true" %}

```bash
kubectl describe pod -n cybus broker-0
```

{% endcode %}

In the output, look at the **Last State** of each container:

{% code lineNumbers="true" %}

```
    Last State:     Terminated
      Reason:       OOMKilled
      Exit Code:    137
```

{% endcode %}

A reason of `OOMKilled` with exit code `137` means the container exceeded its memory limit and the kernel killed it. Other reasons, such as `Error`, point to a different cause that resource tuning alone does not fix.

Raise the memory limit above the storm peak, with headroom, and remove the lowered memory request so it returns to the default. Stop the storm, apply the change with `helm upgrade`, then re-run the storm until the broker stops restarting and its working set stays below the limit at peak:

{% code title="values.yaml" lineNumbers="true" %}

```yaml
broker:
  resources:
    limits:
      memory: 1024Mi
```

{% endcode %}

{% hint style="warning" %}
An undersized memory limit is more severe than an undersized CPU limit. Throttling only slows a container, but an OOMKill drops its in-flight work and forces a cold start, at the exact moment a storm is already straining the system. Size memory limits above the peak working set you measure under the unhappy path, not just steady state.
{% endhint %}

A connection storm is only one unhappy path. Your deployment has others: storage slowdowns or outages, network failures and partitions, node loss, and dependency restarts. Each stresses different components in different ways. Reproduce the failure modes that matter for your infrastructure, measure the resulting peaks the same way, and size limits to absorb them.

## Step 9 — Make Sizing a Recurring Practice

Resource requirements drift as you add services, connect more protocols, and increase throughput. A configuration that fits today is not guaranteed to fit in six months. Revisit your resource configuration on a regular cadence and after any significant change to your workload, and treat right-sizing as ongoing maintenance rather than a one-time task.

For the broader set of operational practices that support running Connectware in production, see [Running Connectware at Scale: 9 Principles](/2-4-1/guides/operation-principles.md).

## Summary

In this guide you:

* Created a local Kubernetes cluster and installed a Prometheus and Grafana metrics stack.
* Drove Connectware with a representative load service.
* Used Grafana dashboards and metrics to find CPU throttling and memory pressure.
* Set per-component requests and limits in the Helm chart and re-tested.
* Tested the unhappy path of mass reconnects, forced a broker OOMKill with an undersized memory limit, and sized limits to absorb the storm spike.
* Established right-sizing as a recurring maintenance practice.

## Further Reading

* [Managing Resources for Containers (Kubernetes)](https://kubernetes.io/docs/concepts/configuration/manage-resources-containers/) — how requests and limits work.
* [Assign CPU Resources to Containers and Pods (Kubernetes)](https://kubernetes.io/docs/tasks/configure-pod-container/assign-cpu-resource/) — CPU requests, limits, and throttling.
* [Assign Memory Resources to Containers and Pods (Kubernetes)](https://kubernetes.io/docs/tasks/configure-pod-container/assign-memory-resource/) — memory limits and the OOMKilled behavior.
* [CFS Bandwidth Control (Linux kernel documentation)](https://docs.kernel.org/scheduler/sched-bwc.html) — the mechanism that throttles a container at its CPU limit.
* [Configuring Compute Resources](/2-4-1/cybus-helm-charts/working-with-cybus-helm-charts/compute-resources.md) — the full Helm syntax for both the `connectware` and `connectware-agent` charts.


---

# Agent Instructions
This documentation is published with GitBook. GitBook is the documentation platform designed so that both humans and AI agents can read, navigate, and reason over technical content effectively. Learn more at gitbook.com.

## Querying This Documentation
If you need additional information that is not directly available in this page, you can query the documentation dynamically by asking a question.

Perform an HTTP GET request on the current page URL with the `ask` query parameter, and the optional `goal` query parameter:

```
GET https://docs.cybus.io/2-4-1/guides/right-sizing-kubernetes-resources.md?ask=<question>&goal=<endgoal>
```

`ask` is the immediate question: it should be specific, self-contained, and written in natural language.
`goal` is optional and describes the broader end goal you are ultimately trying to accomplish on behalf of the user. GitBook uses it to tailor the answer towards what is most useful for that goal.

The response will contain a direct answer to the question and relevant excerpts and sources from the documentation.

Use this mechanism when the answer is not explicitly present in the current page, you need clarification or additional context, or you want to retrieve related documentation sections.