Data Explorer

Visualize, monitor, and troubleshoot MQTT topics and payloads.

The Data Explorer provides a centralized interface to visualize, monitor, and troubleshoot MQTT messages in Connectware. Messages are organized into topics, enabling structured data flow between publishers and consumers.

For monitoring the MQTT topics of a single service, use the Live Data tab.

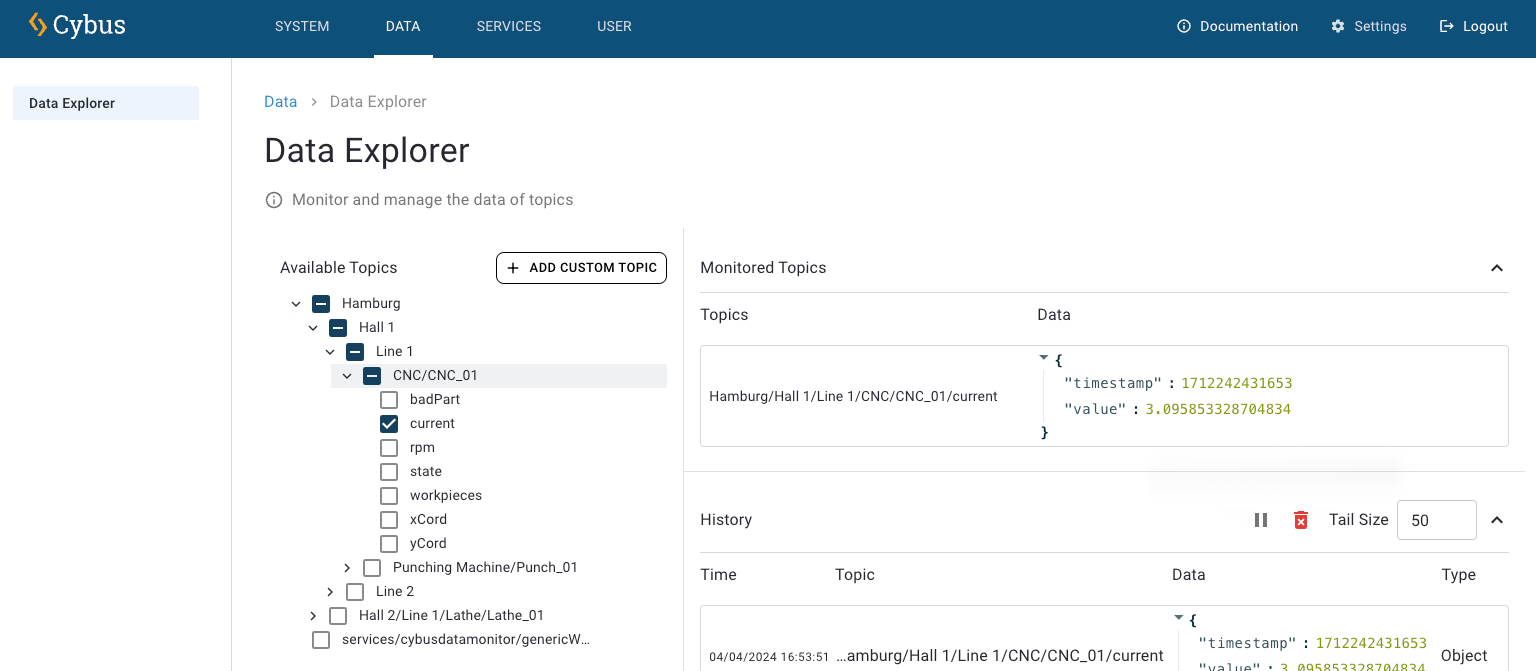
Screenshot of the Data Explorer main interface

Data Explorer at a Glance

  • To open the Data Explorer, click Data in the navigation panel.

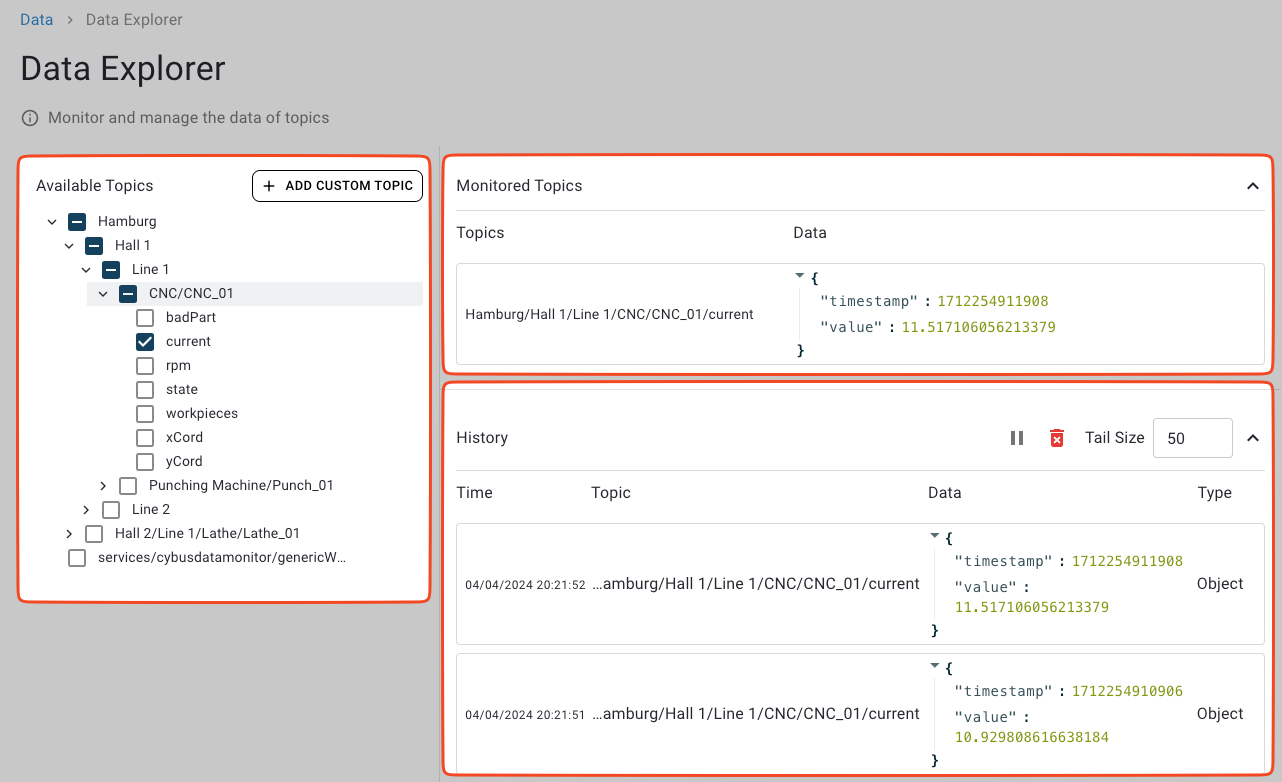
The Data Explorer is divided into the following sections:

  • Available Topics (left): Browse the topic tree and choose what to monitor.

  • Monitored Topics (right): See the latest values for your selected topics.

  • History (bottom): A log of updates received for the monitored topics.

Screenshot highlighting Data Explorer sections
Overview of Data Explorer sections: Available Topics, Monitored Topics, and History.
Copying Topic Data to the Clipboard

The data values displayed in the Monitored Topics and in the History section correspond to the data type of their topic.

  • Numbers and strings appear as plain text. Select and copy them as usual.

  • JSON objects show a clipboard icon on hover. Click it to copy the JSON to your clipboard.

Screenshot showing clipboard icon for copying JSON data
Clipboard icon appears for JSON objects to enable easy copying.

Available Topics

The Available Topics section displays all MQTT topics that are available in Connectware in a hierarchical structure. The base topics are at the highest level. Click the down arrows to expand the topic structure.

Topics are only shown if they have at least one active subscription. Topics that are not linked to a Connectware resource are also displayed.

Wildcard topics (+) are displayed in the topic tree without showing actual topic names.

Screenshot of Available Topics tree structure
Available Topics section showing hierarchical topic tree.
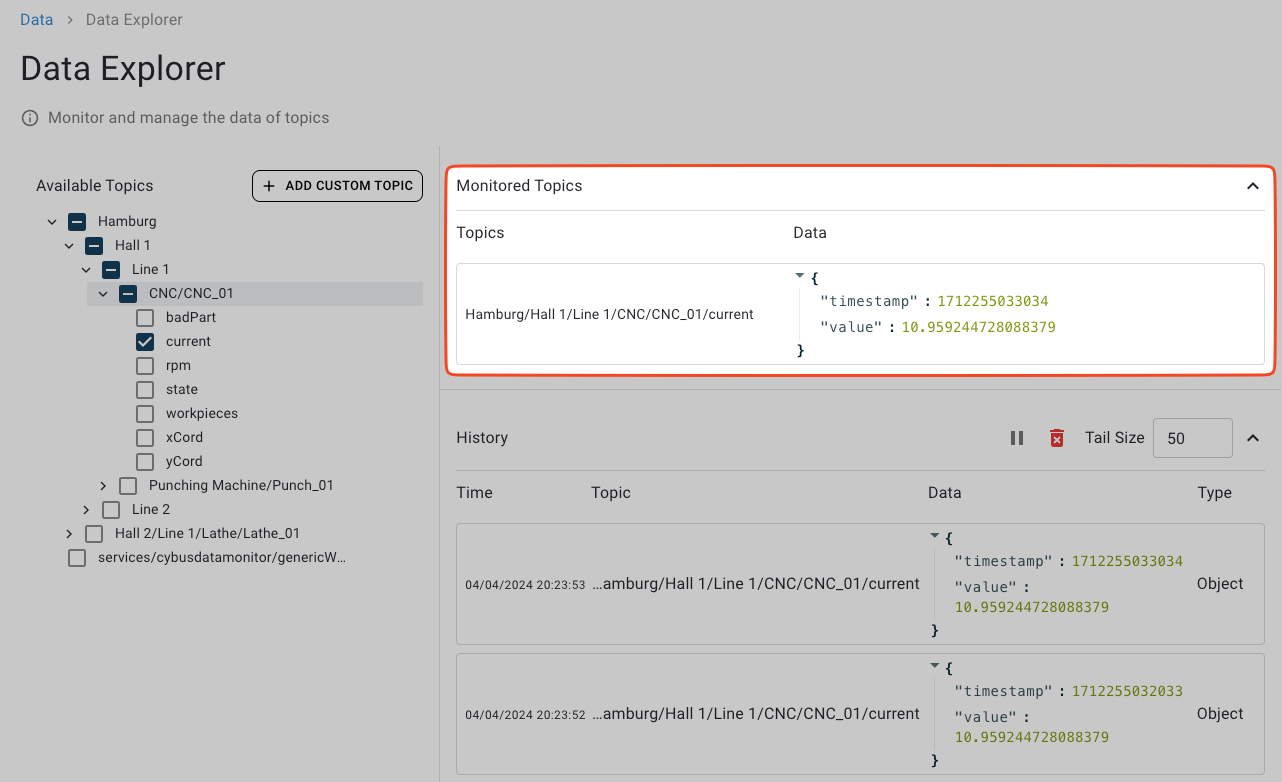
Monitored Topics

The Monitored Topics section always shows the latest payload per topic. Each time a new message arrives, the corresponding value is updated.

By default, 25 topics are displayed.

  • To show more topics, click Show the Next 25 at the end of the monitored topics list.

Screenshot of Monitored Topics section
Monitored Topics section displaying latest values for selected topics.

Adding or Removing Topics from the Monitored Topics List

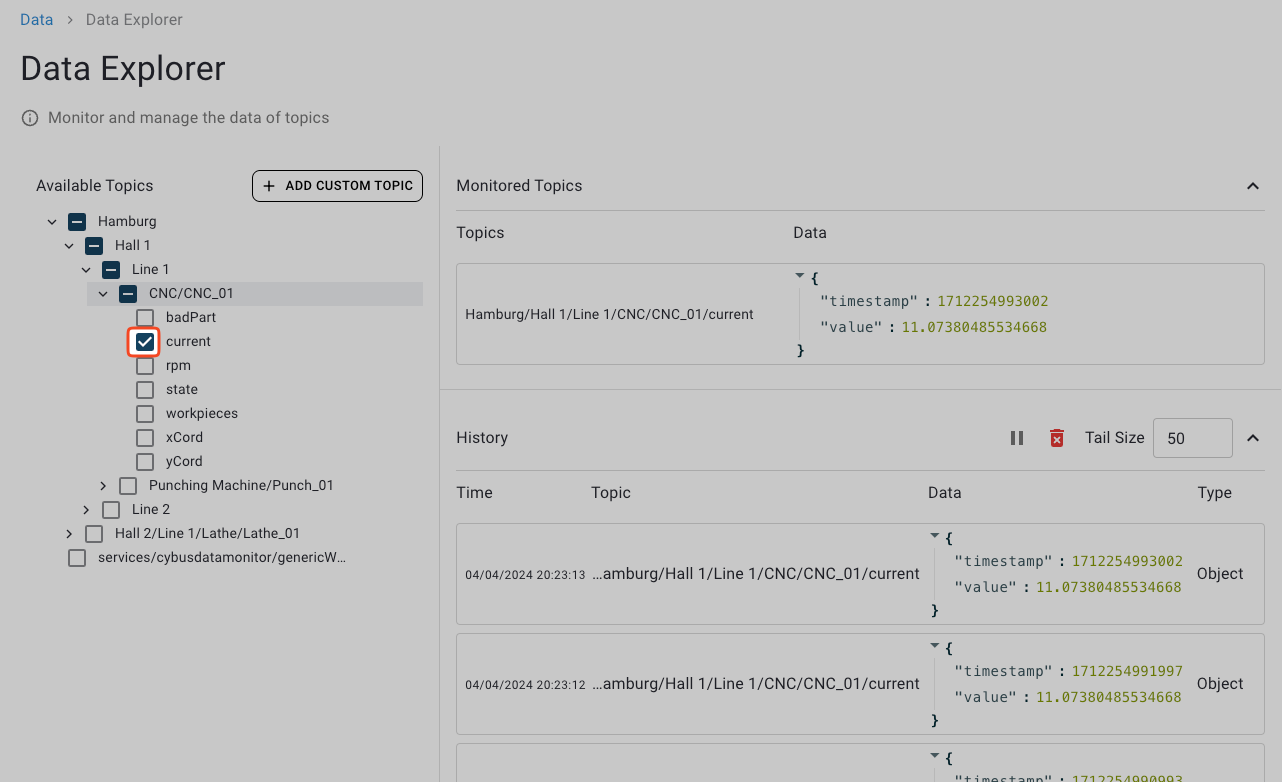
  • To add a topic to the monitored topics list, check the corresponding checkbox in the Available Topics section.

  • To remove a topic from the monitored topics list, uncheck the corresponding checkbox in the Available Topics section.

History

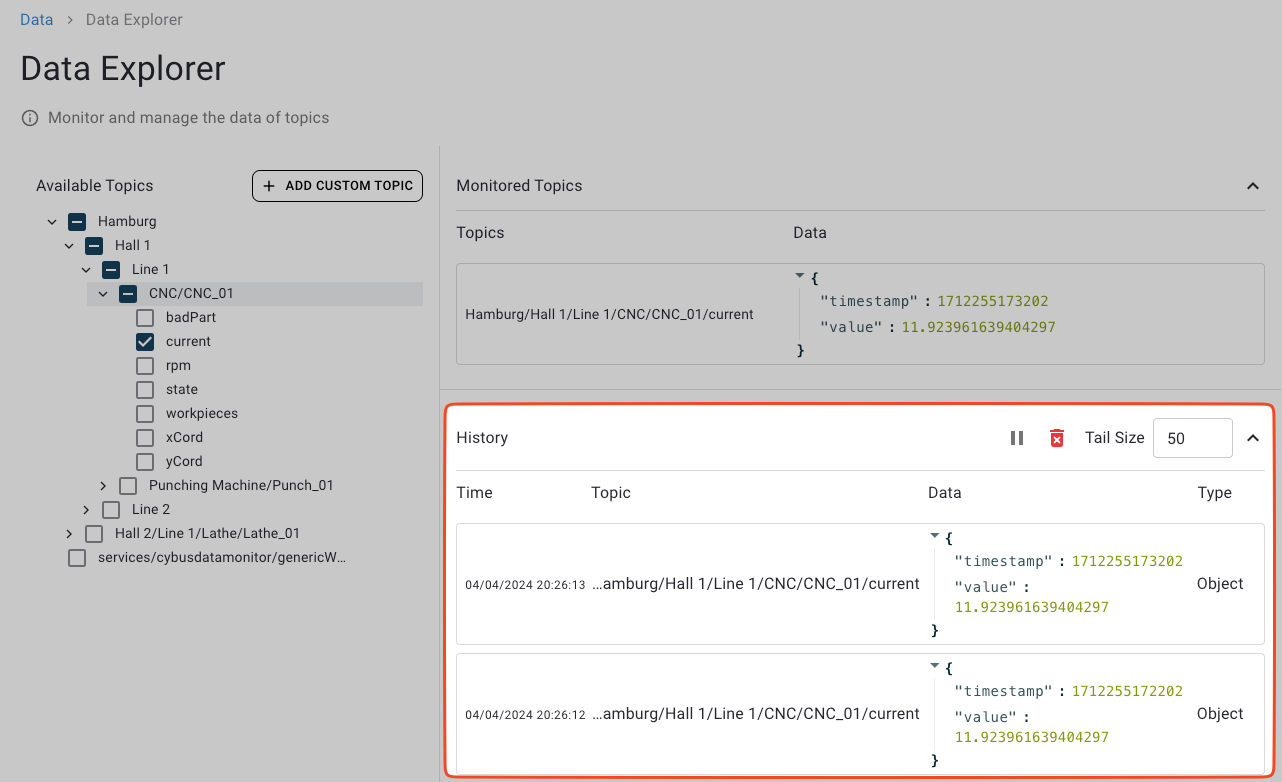
The History section allows you to view logs of all updates from the currently monitored topics. Every time an update to a monitored topic is available, a new log line will be appended to the history.

Screenshot of History log section
History section showing log of monitored topics.

Pausing or Resuming Log Updates

You can pause the log updates to inspect specific log lines.

  • To temporarily stop live updates, click the Pause icon in the top-right of the History section. Click again to resume.

Clearing the Log

  • To remove all recorded log lines, click the Trash icon in the top-right of the History section.

Displaying More or Fewer Log Lines

  • To set how many of the most recent log entries the History section should display, set the Tail Size value.

Last updated

Was this helpful?